UI Overview
Overview
This page introduces you to the platform's user interface (UI), highlighting primary concepts to help you get oriented quickly and navigate with confidence.
Navigation Model
Our hypervisor uses an overview-to-detail navigation model that allows you to start with high-level summaries and drill down into specific assets as needed. This hierarchical approach organizes information from system-wide summaries down to individual components.
How It Works:
The navigation model follows a consistent three-level pattern throughout the system:
- System Level: The Main Dashboard shows aggregate statistics and health across all resources
- Module Level: Dashboards for VMs, Networks, Storage, etc., display summaries for that resource type
- Object Level: Individual resource dashboards (specific VM, network, or node) provide detailed information and management controls
At each level, you can:
- View summary statistics and current status
- Access relevant logs and activity history
- Click through to more detailed views
- Navigate directly to related resources
Example Navigation Flow:
This model supports both broad monitoring (checking overall system health) and targeted administration (configuring a specific component).
Dashboards
Dashboards are the foundation of the platform's UI, providing information and serving as navigation hubs. Every major area of the system has a dashboard, from the system-wide Main Dashboard down to individual resource instances.
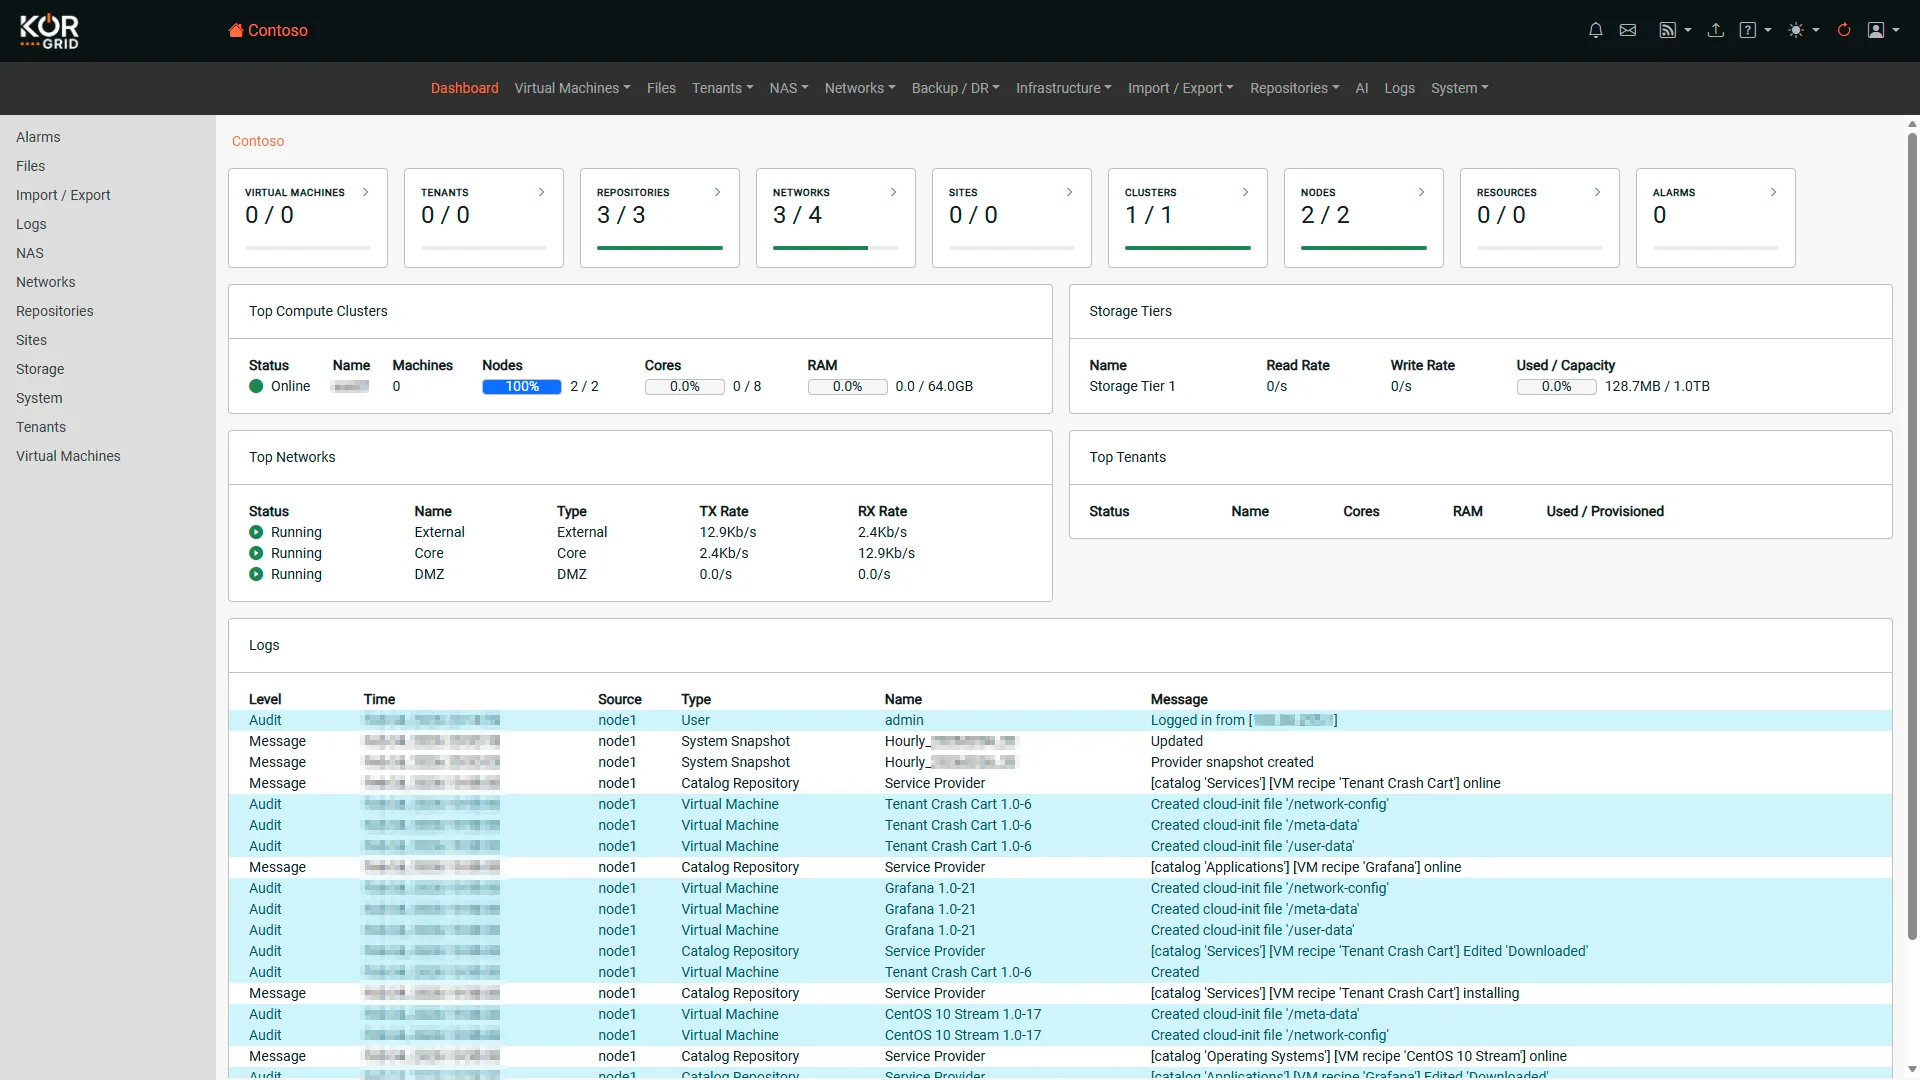
Main Dashboard
The home screen displays the Main Dashboard for your tenant, serving as your primary starting point. This view includes:
System-Wide Statistics
- Aggregate counts for VMs, networks, storage, tenants, and nodes
- Current resource utilization (CPU, RAM, storage)
- Health status indicators with color-coded alerts
Activity and Monitoring
- Real-time system logs showing recent events and actions
- Performance metrics and trending indicators
- Alert notifications for issues requiring attention
Navigation Elements
- Left menu for accessing major system modules
- Quick links to frequently used resources
- Direct access to administrative functions
Quick Access Sections
- Top compute resources by utilization
- Most active networks
- vSAN tier status and capacity
- Tenant resource consumption (in multi-tenant environments)
From the Main Dashboard, you can quickly assess system health and navigate to any area requiring attention or configuration.
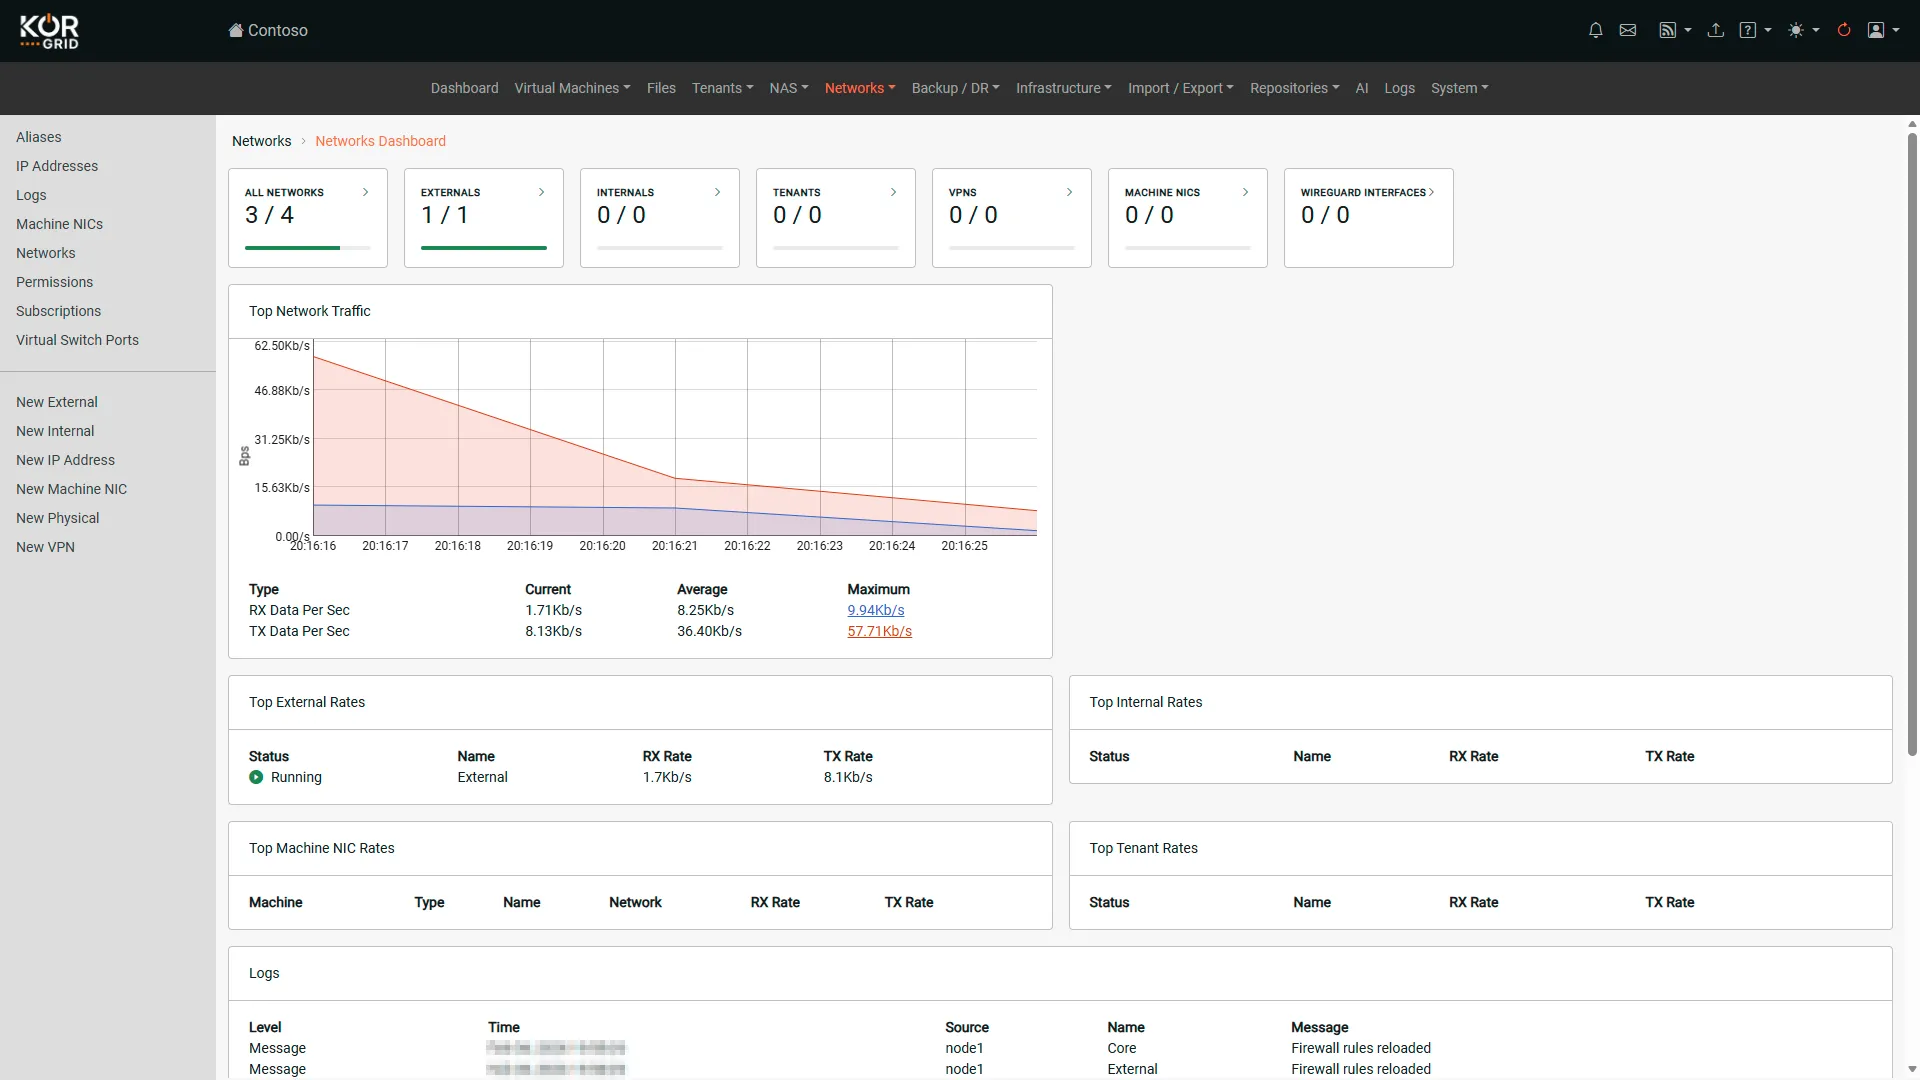
Networks Dashboard
The Networks Dashboard provides:
- Overall network statistics (total networks, active connections, throughput)
- List of all networks with their status and configuration
- Network-specific logs and recent activity
- Links to individual network dashboards for detailed management
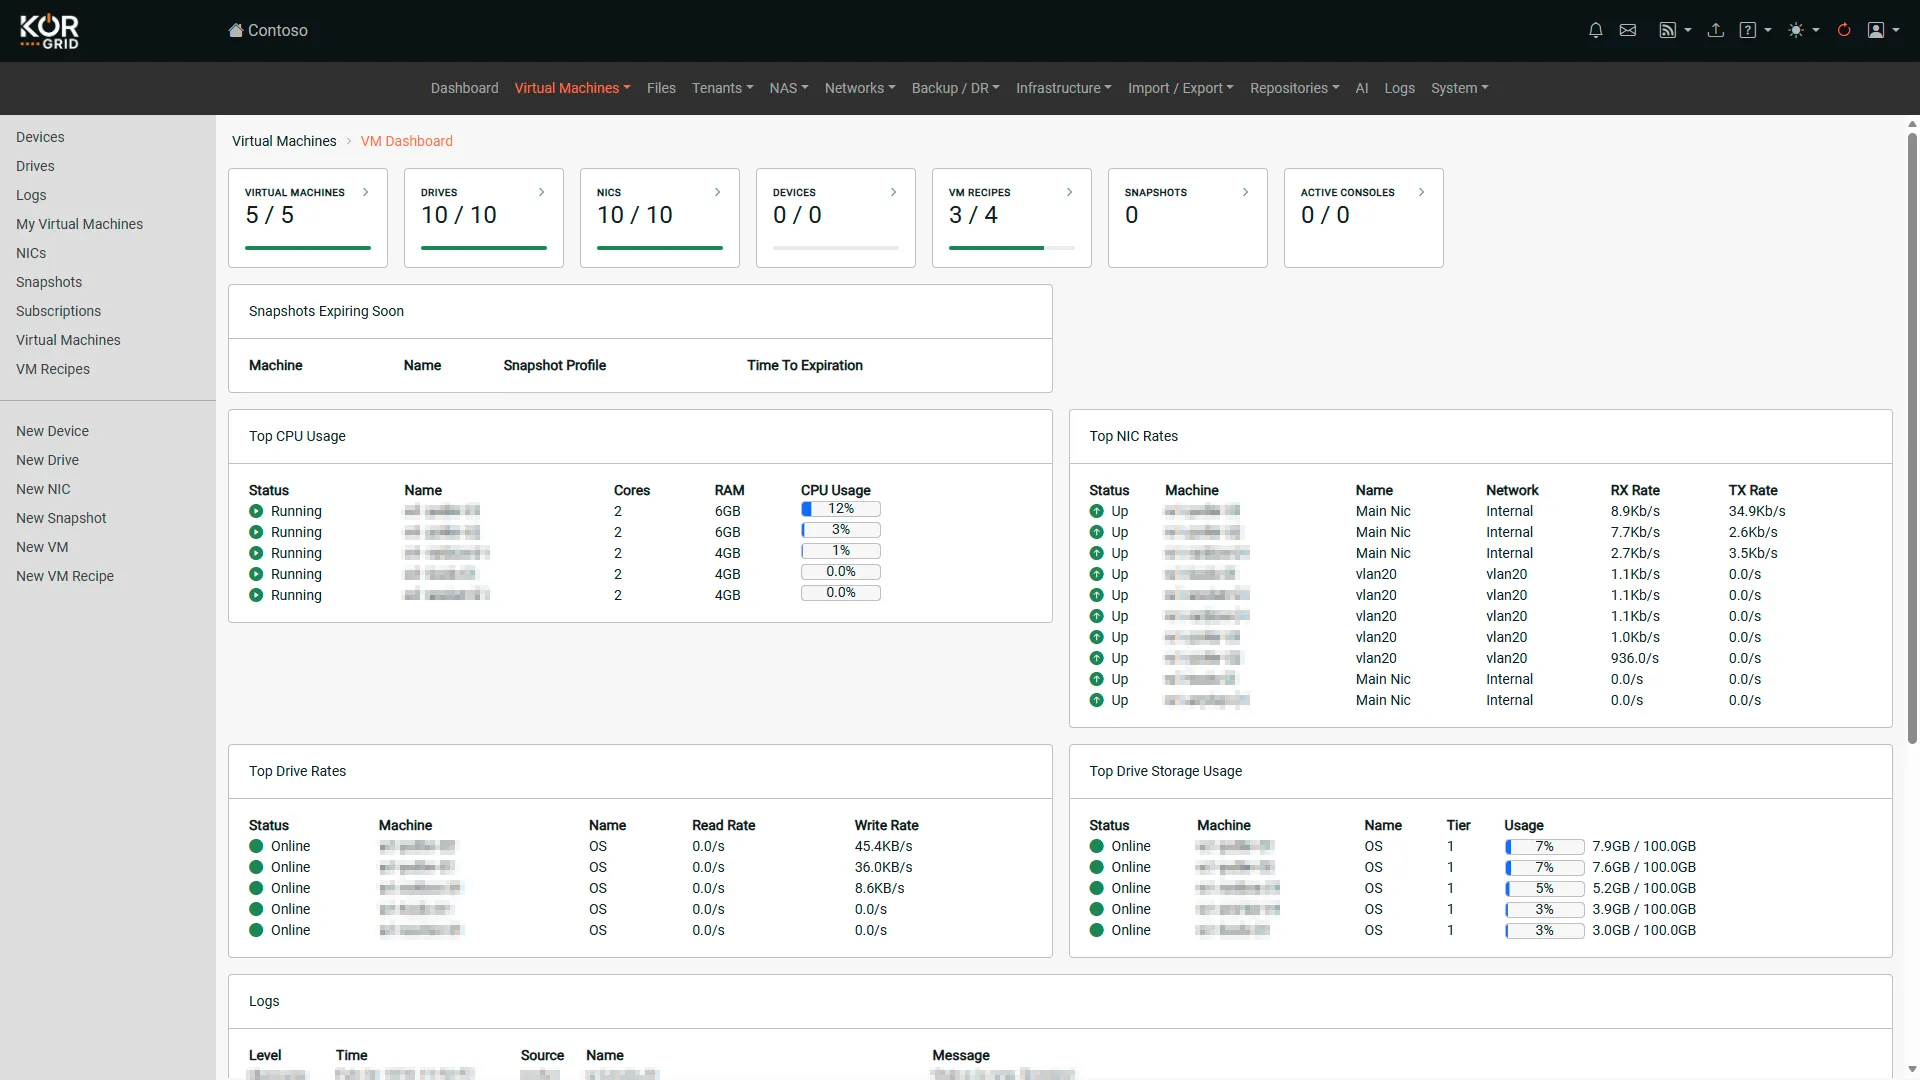
Machines Dashboard
The Machines Dashboard provides an overall view of all virtual machines for your VDC. It also allows you to see the top-talkers and resource consumers.
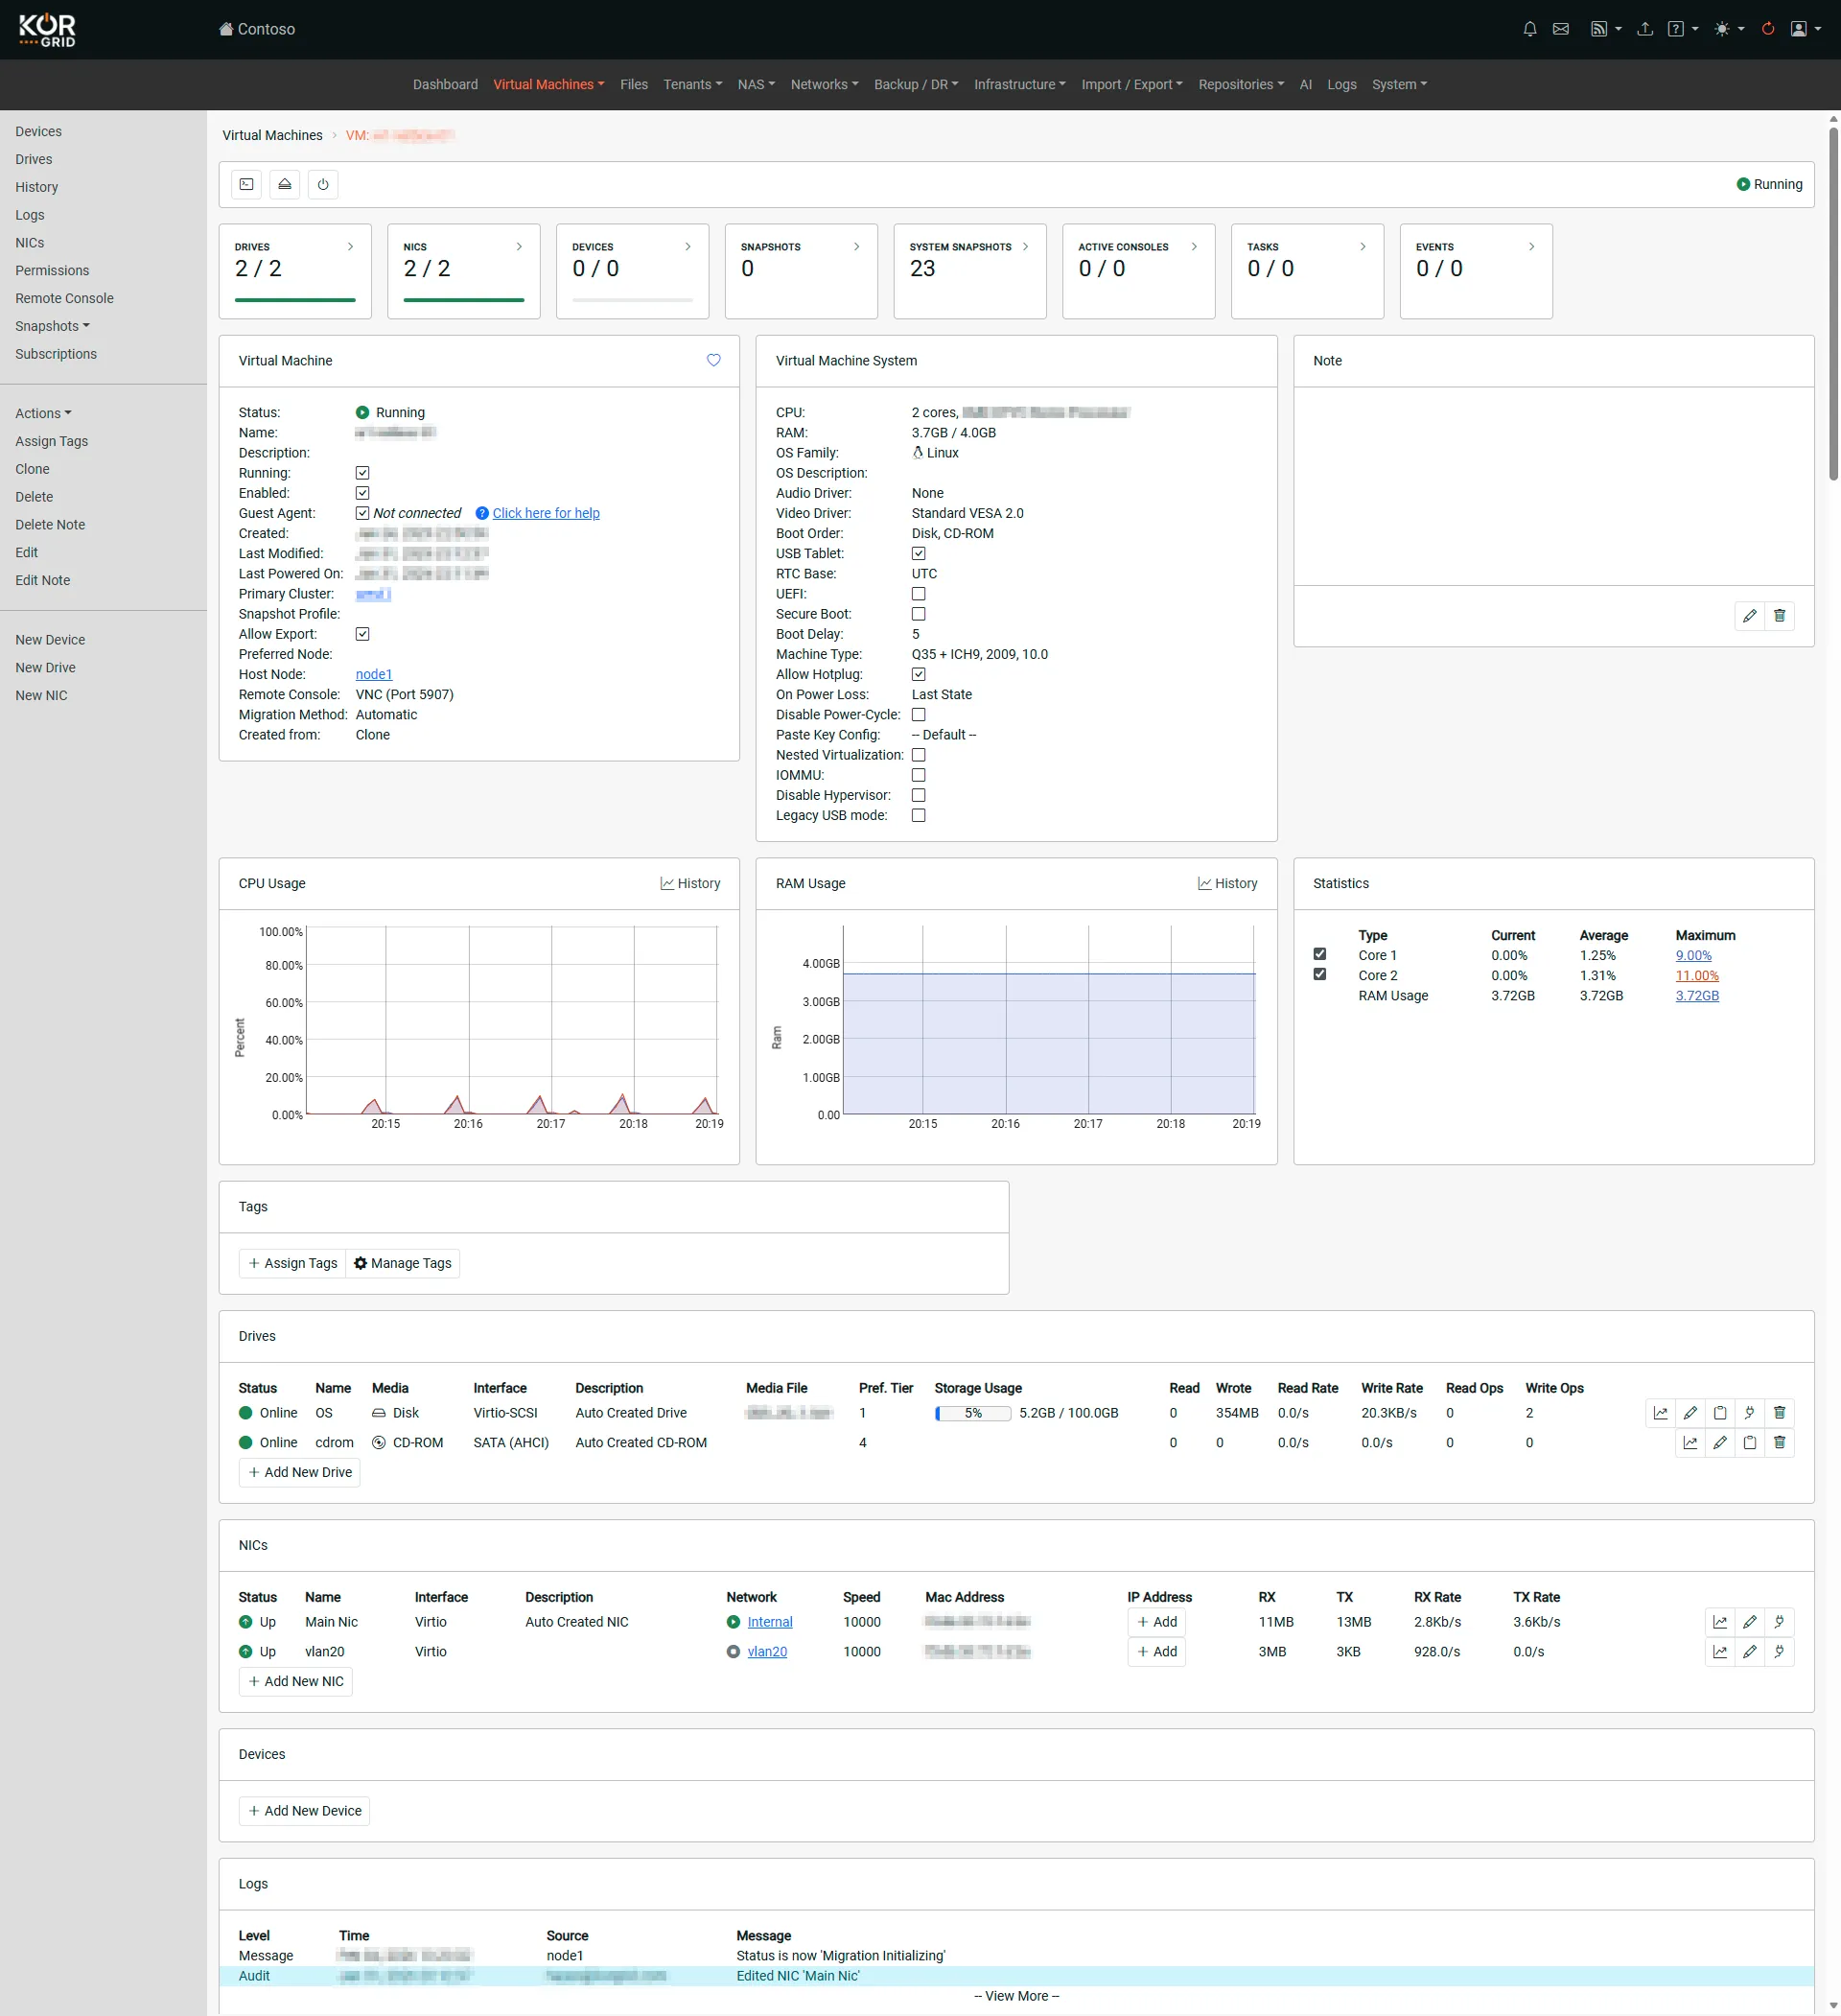
VM Dashboard
There is a dashboard available for each individual virtual machine. The dashboard for a VM will show important information for the specific instance. Links on the VM dashboard allow for accessing detailed information regarding its drives, NICS, snapshots, devices, host node, etc.
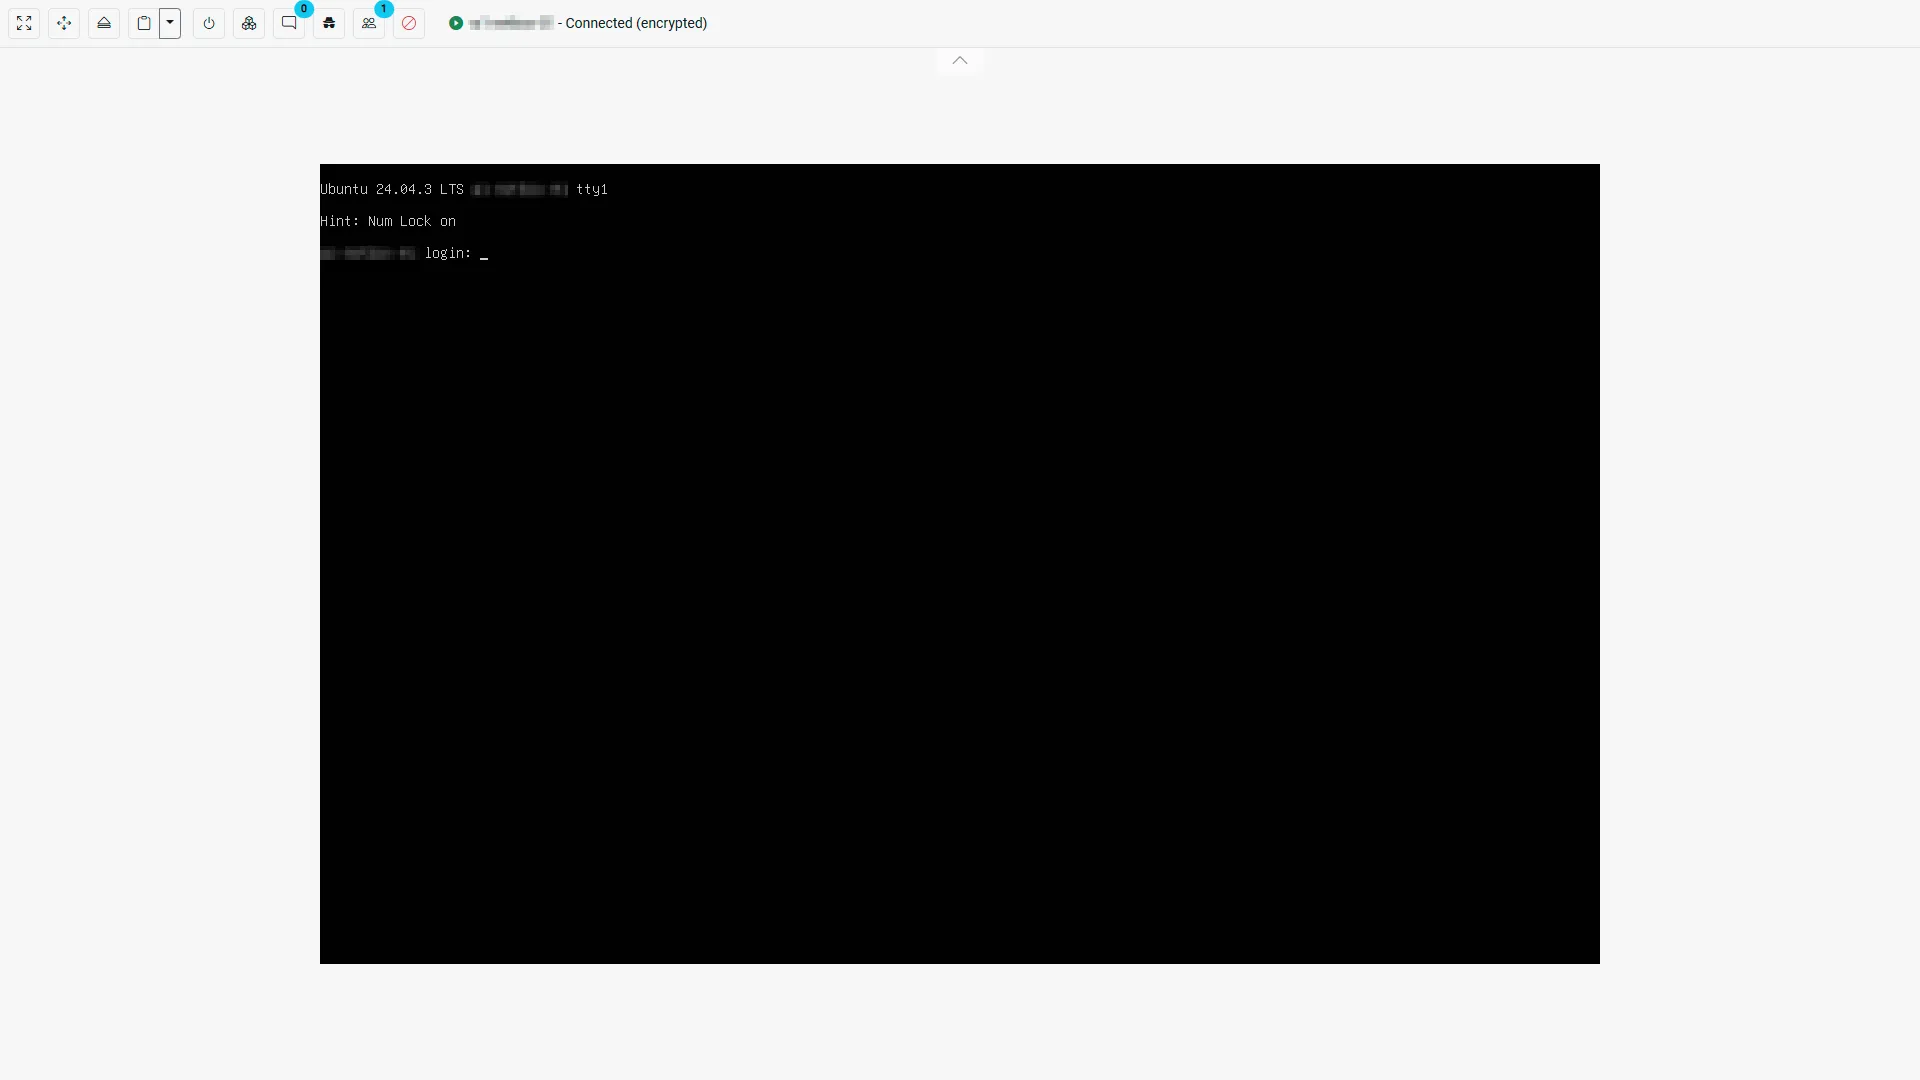
VM Console
Access a VM console for out-of-band management.
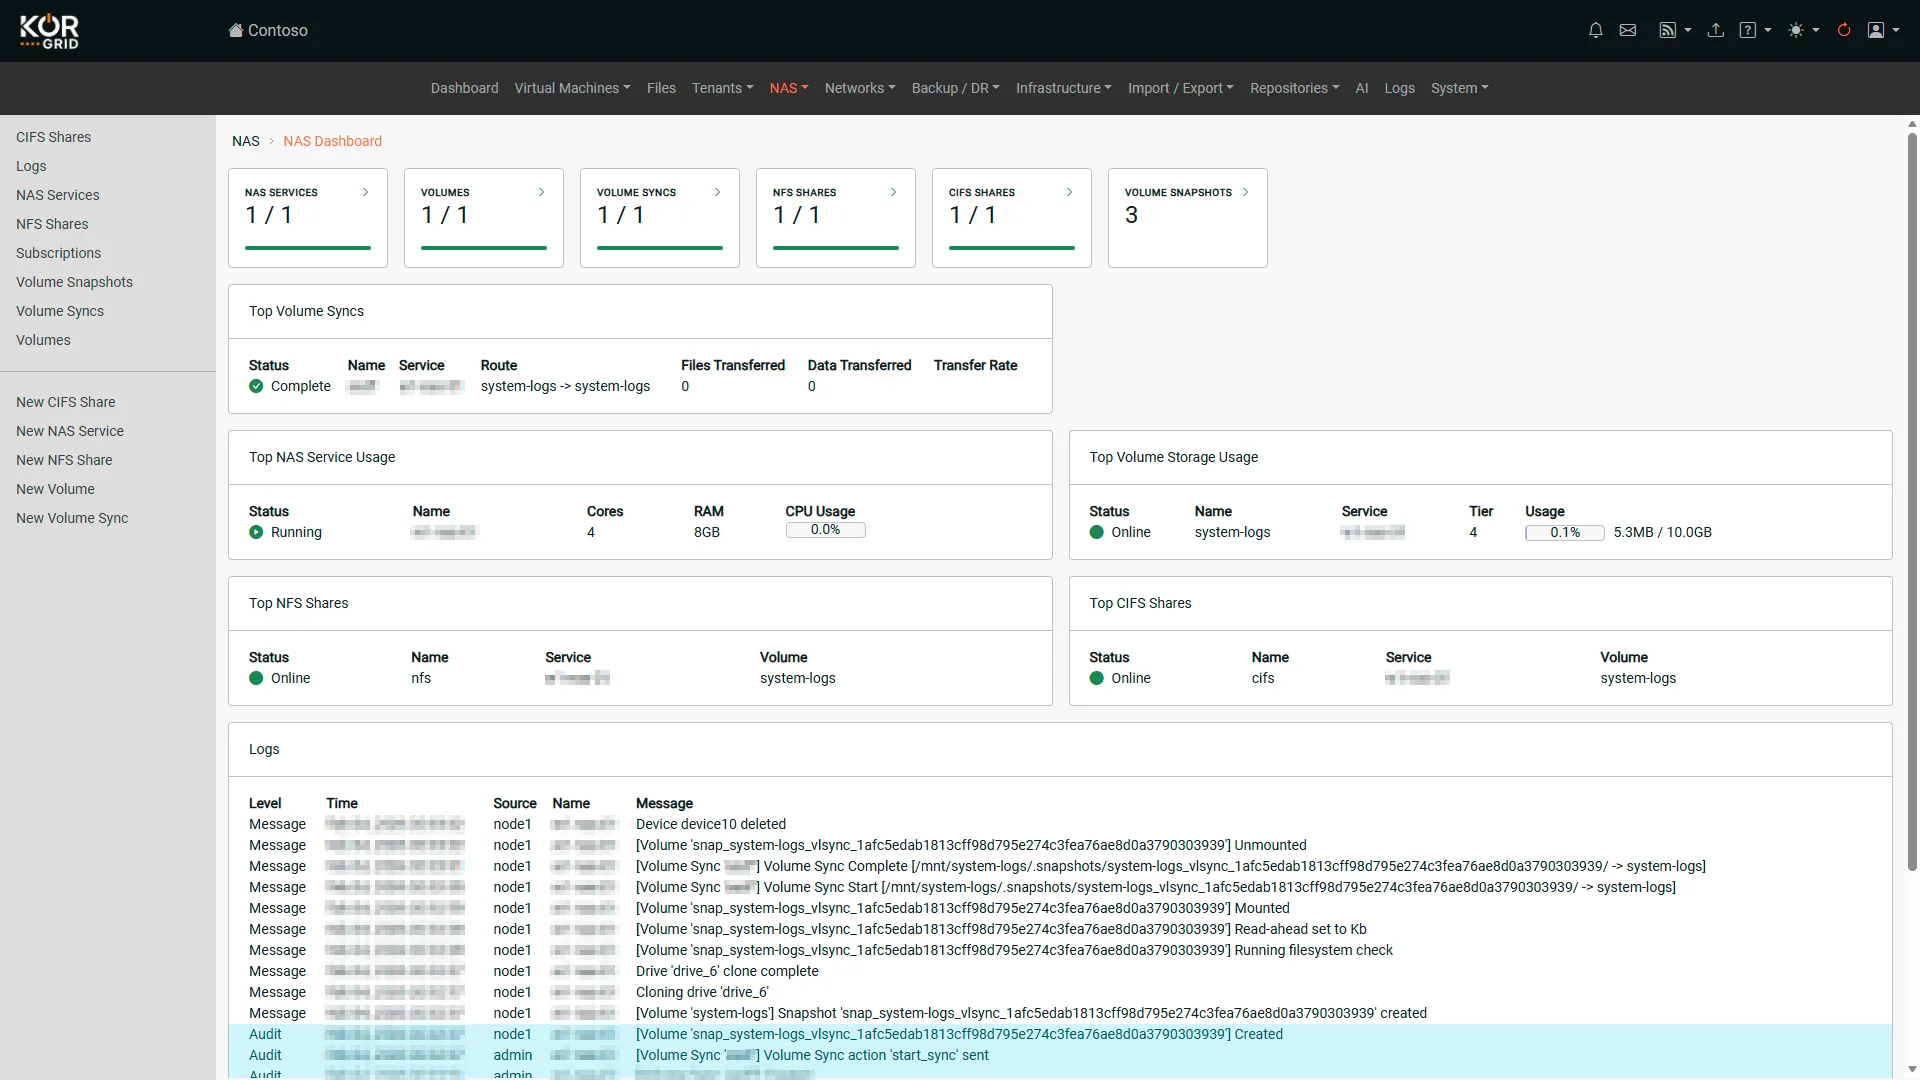
NAS Dashboard
The NAS dashboard provides an overall view of all NAS services running within your VDC, including any NFS or CIFS shares you have created.
Menus
The UI includes three primary menu systems that work together to provide comprehensive access to all system functions. Understanding how these menus work and when to use each one streamlines your workflow.
Top Navigation Bar
The top navigation bar remains visible at all times, providing persistent access to major system modules. This menu includes:
Primary Modules
- Dashboard (returns to Main Dashboard)
- Virtual Machines
- Networks
- Storage
- Tenants
- System
Utility Functions
- Notifications center
- Messages and communications
- RSS feeds and activity streams
- Download center for exports and reports
- User menu and settings
The top navigation allows you to quickly switch between different areas of the system without losing your current context. For example, you can switch from managing a VM to reviewing network configuration, then return to the VM exactly where you left off.
Left Context Menu
The left menu displays context-sensitive options based on your current location in the interface. As you navigate through the system, this menu dynamically updates to show relevant actions and views, with menu items organized alphabetically.
At Module Level (e.g., on Networks Dashboard):
- Dashboard (module overview)
- New (create new resource)
- Settings (module configuration)
- Help (module-specific documentation)
At Object Level (e.g., viewing a specific VM):
- Dashboard (resource overview)
- View (detailed information)
- Edit (configuration changes)
- Power (start/stop controls)
- Snapshots (backup management)
- Console (direct access)
- Advanced (specialized functions)
Your current module location is indicated near the top of the left menu, helping you maintain awareness of where you are in the system hierarchy.
User Menu
Located in the top-right corner (click your username), this menu provides user-specific settings and actions:
Account Management
- Update display name
- Change password
- Configure two-factor authentication
- Manage SSH keys
Preferences
- Theme selection (light/dark/custom)
- Notification settings
- Default landing page
Session Controls
- Switch tenant context (in multi-tenant environments)
- Logout